Sunday, February 5, 2023

Data Science for Marketing and Planning

Data science can be applied in marketing and planning to help organizations make better decisions by analyzing large amounts of data from various sources. Some examples of how data science can be applied in marketing and planning are:

Customer segmentation: using demographic, behavioral, and transactional data to segment customers into different groups with similar characteristics, which can help target marketing efforts more effectively.

Predictive modeling: using historical data on customer behavior and demographics to predict future customer behavior, such as which customers are likely to respond to a marketing campaign or make a purchase.

Marketing mix modeling: using data on marketing campaigns, sales, and other factors to determine the optimal mix of marketing activities, such as advertising, promotions, and pricing, to achieve specific business objectives.

Sentiment analysis: using natural language processing techniques to analyze customer reviews, social media posts, and other text data to understand customer attitudes and opinions.

Personalization: using data on customer preferences, browsing history, and purchase history to personalize the customer experience and tailor marketing messages and recommendations.

Overall, Data Science can help marketing and planning teams to make data-driven decisions and to optimize their marketing strategies. Additionally, it can also help to improve the overall customer experience by providing more relevant and personalized communication and recommendations.


Happy Learning.

Wednesday, January 25, 2023

Data Science use cases in Healthcare domain

Data science in healthcare involves the use of data, statistical algorithms, and machine learning techniques to extract knowledge and insights from structured and unstructured medical data. This knowledge can be used to improve patient care, identify high-risk individuals, and inform public health policy.

Some specific applications of data science in healthcare include:

Predictive modeling: using patient data to predict the likelihood of certain outcomes, such as hospital readmission or disease progression, and identify high-risk individuals who may benefit from targeted interventions.

Electronic Health Record (EHR) analysis: using natural language processing (NLP) techniques to extract relevant information from unstructured EHR data and use it to improve patient care, population health management, and research.

Medical imaging analysis: using machine learning algorithms to automatically identify and diagnose diseases from medical images such as X-rays, CT, and MRI scans.

Fraud detection: using data mining techniques to identify patterns of fraudulent activity, such as false billing or kickbacks, in healthcare organizations.

Clinical decision support: using data and machine learning to provide doctors and other healthcare professionals with real-time recommendations for patient care based on the latest medical research and best practices.

Population health management: using data and analytics to understand the health of a population and identify risk factors that contribute to chronic diseases and other health problems.

Personalized medicine: using data on a patient's genetic makeup, medical history, and other factors to tailor treatment and medication plans to their specific needs.

Drug discovery and development: using data science techniques to mine large data sets of chemical compounds to identify potential drug candidates and accelerate drug discovery and development.

Overall, data science has the potential to revolutionize healthcare by enabling the use of large amounts of data to improve decision-making, identify new treatments, and ultimately improve patient outcomes.

Data Science Use Cases in Risk and Finance Sector

Data science can be applied in the risk and finance sector in a variety of ways, such as:

Credit risk modeling: Using historical data on loan defaults and other factors to predict the likelihood of a borrower defaulting on a loan in the future.

Fraud detection: Using machine learning algorithms to identify patterns of suspicious behavior in financial transactions.

Algorithmic trading: Using data and mathematical models to make automated trades in financial markets.

Portfolio optimization: Using data on historical stock prices and other financial indicators to build mathematical models that can help optimize the performance of a portfolio of investments.

Risk management: Using data to model and measure different types of risk, such as market risk, credit risk, and operational risk, to help financial institutions make more informed decisions.

Overall, Data Science can be used to identify patterns, trends, and insights in financial data, which can help financial institutions make more informed decisions and manage risk more effectively.

Friday, January 20, 2023

Problem solving skills and mindset : Data Science

Problem-solving skills are crucial for a data scientist because data science is a discipline that is focused on solving problems using data. In order to be effective in this field, a data scientist must be able to identify the problem that needs to be solved, formulate a plan for solving it and execute that plan using appropriate data science techniques. This requires strong analytical and critical thinking skills, as well as the ability to work with large and complex data sets. Additionally, data scientists must be able to communicate their findings and solutions to a wide variety of stakeholders, which requires strong problem-solving and presentation skills.

How to create a problem-solving mindset - 

1. Practice: The more problems you solve, the better you will become at solving them. Look for opportunities to practice your problem-solving skills, such as participating in data science competitions, hackathons, or working on personal projects.

2. Learn new techniques and tools: Stay up to date with the latest data science techniques and tools, and practice using them to solve problems. This will broaden your skill set and give you more problem-solving options.

3. Collaborate: Work with others to solve problems. Collaborating with others allows you to learn from their perspectives and approach to problem-solving.

4. Seek feedback: Ask for feedback on your problem-solving approach and listen to the suggestions provided. This will help you identify areas of improvement and learn from your mistakes.

5. Read: Read books and articles about problem-solving, decision-making, and critical thinking. This will expose you to different ways of approaching problems and help you develop your own problem-solving style.

6. Learn from failure: Don't be afraid to fail. Failure is an opportunity to learn and improve. Reflect on what went wrong and what you could do differently next time.

Data Science beyond Machine Learning - 

Understand the broader scope of data science: Learn about the different subfields within data science, such as data mining, statistics, and data visualization. This will give you a better understanding of how data science can be applied to solve problems in many different fields.

Learn the business context: Understand how data science can be used to support business goals, such as reducing costs, increasing revenue, or improving customer experiences. This will help you see how data science can be used to create value beyond just building models.

Work on projects outside of machine learning: Take on projects that involve other aspects of data science, such as data cleaning, data visualization, and data storytelling. This will help you develop a more well-rounded set of skills.

Seek out diverse learning opportunities: Attend workshops, conferences, and meetups that focus on different areas of data science. This will expose you to different perspectives and ways of thinking about data science.

Collaborate with other data professionals: Work with data engineers, data analysts, and business analysts, who have different skill sets and perspectives. This will help you understand how data science can be used to support different business processes and workflows.

Read widely: Read articles and books on data science and related topics, such as statistics, business, and design. This will help you develop a broader understanding of how data science is used in different fields and contexts.

Wednesday, March 24, 2021

Decision Trees Basics

Decision tree learning is one of the predictive modeling approaches used in statisticsdata mining, and machine learning. It uses a decision tree (as a predictive model) to go from observations about an item (represented in the branches) to conclusions about the item's target value (represented in the leaves). Tree models where the target variable can take a discrete set of values are called classification trees; in these tree structures, leaves represent class labels and branches represent conjunctions of features that lead to those class labels. Decision trees where the target variable can take continuous values (typically real numbers) are called regression trees. Decision trees are among the most popular machine learning algorithms given their intelligibility and simplicity.

The Decision Tree algorithm belongs to the family of supervised learning algorithms. Unlike other supervised learning algorithms, the decision tree algorithm can be used for solving regression and classification problems too.

The goal of using a Decision Tree is to create a training model that can use to predict the class or value of the target variable by learning simple decision rules inferred from prior data(training data).


Let us take an example: - A men gets an offer from a company, and we are building a decision tree, does he accepts the offer or not?

Suppose the first feature is 'salary': how much salary did he get? In the above diagram, our first feature is salary, and it ranges between (50k - 80k) $. There are two conditions based on this salary range, the first is that the salary is in the middle of the range, then the men accept the offer otherwise, he rejects the offer.

So far, we have satisfied one condition, but have some more features. Our second feature is the 'office near the house': is the office near the house or not? If yes, he accepts the offer otherwise he rejects the offer.

The third feature is whether the company provides a 'cab facility' or not? If yes, he accepts the offer otherwise he rejects the offer.

Therefore, based on the features, we created a tree base structure and decided whether the proposal was accepted or not.


Important Terminology related to Decision Trees


Root Node: 
It represents the entire population or sample and this further gets divided into    two or more homogeneous sets.

Splitting: It is a process of dividing a node into two or more sub-nodes.

Decision Node: When a sub-node splits into further sub-nodes, then it is called the decision node.

Leaf / Terminal Node: Nodes do not split is called Leaf or Terminal node.

Pruning: When we remove sub-nodes of a decision node, this process is called pruning. You can say the opposite process of splitting.

Branch / Sub-Tree: A subsection of the entire tree is called a branch or sub-tree.

Parent and Child Node: A node, which is divided into sub-nodes is called a parent node of sub-nodes whereas sub-nodes are the child of a parent node.


So far, we have covered the basic understanding of the decision tree algorithm and its terminology. In an upcoming blog, we will discuss advanced topics such as - how to split decision trees, different splitting criteria, how to optimize the performance of decision trees, and more.  


Happy Learning :-)


References - 

image reference - img_ref

Wikipedia reference - wiki


Wednesday, March 10, 2021

Central Limit Theorem

The Central Limit theorem defines that the mean of the given sample is the same as the mean of the population (approx). No matter how bigger the population, we can infer the statistics of the population with the help of the sample

Central Limit Theorem Definition:

The central limit theorem states that if you have a population with mean μ and standard deviation σ and take sufficiently large random samples from the population with replacement, then the distribution of the sample means will be approximately normally distributed.

Central Limit Theorem Example:

Let us take an example to understand the concept of the Central Limit Theorem (CLT):


Suppose you want to calculate the average weight of the country. The first step in this would be to measure the height of all the people individually and then add them. Then, Divide the sum of their weights by the total number of people. This way we will get the average height. But this method will not make sense for long calculations as it would be tiresome and very long.

So, we will use CTL(Central Limit Theorem) to make the calculation easy. In this method, we will randomly pick peoples from different cities and make a sample.  we will make the samples city-wise and each sample will include some peoples. Then, we will follow the following steps to solve it.

  • Take all these samples and find the mean.
  • Now, Find the mean of the sample means.
  • This way we will get the approximate mean height of the people in the country.
  • We will get a bell curve shape if we will find the histogram of these sample mean heights.


  • Central Limit Theorem Formula:

    The central limit theorem is applicable for a sufficiently large sample size (n≥30). The formula for the central limit theorem can be stated as follows:

    Where,

    μ = Population mean

    σ = Population standard deviation

    μx = Sample mean

    σx= Sample standard deviation

    n = Sample size

    Applications of Central Limit Theorem:

    Statistical Applications

    • If the distribution is not known or not normal, we consider the sample distribution to be normal according to CTL. This method assumes that the population given is normally distributed. This helps in analyzing data in methods like constructing confidence intervals.
    • To estimate the population means more accurately, we can increase the samples taken from the population which will ultimately decrease the sample means deviation.

    Practical Significance 
    • One of the most common applications of CLT is in election polls. To calculate the percentage of persons supporting a candidate which are seen on news as confidence intervals.
    • It is also used to measure the mean or average family income of a family in a particular region.


    Saturday, March 6, 2021

    Generative Adversarial Networks (GANs)

    Deep neural networks are used mainly for supervised learning: classification or regression. Generative Adversarial Networks or GANs, however, use neural networks for a very different purpose: Generative modeling. 

    Introduction to Generative Modeling

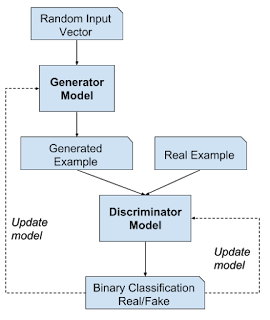
    Generative modeling is an unsupervised learning task in machine learning that involves automatically discovering and learning the regularities or patterns in input data in such a way that the model can be used to generate or output new examples that plausibly could have been drawn from the original dataset.

    While there are many approaches used for generative modeling, a Generative Adversarial Network takes the following approach:


    There are two neural networks: a Generator and a Discriminator. The generator generates a "fake" sample given a random vector/matrix, and the discriminator attempts to detect whether a given sample is "real" (picked from the training data) or "fake" (generated by the generator). Training happens in tandem: we train the discriminator for a few epochs, then train the generator for a few epochs, and repeat. This way both the generator and the discriminator get better at doing their jobs.

    GANs, however, can be notoriously difficult to train and are extremely sensitive to hyperparameters, activation functions, and regularization. 

    Discriminator Network

    The discriminator takes an image as input, and tries to classify it as "real" or "generated". In this sense, it's like any other neural network. We'll use a convolutional neural network (CNN) which outputs a single number output for every image. We'll use a stride of 2 to progressively reduce the size of the output feature map.

    Just like any other binary classification model, the output of the discriminator is a single number between 0 and 1, which can be interpreted as the probability of the input image being real i.e. picked from the original dataset.

    Generator Network

    The input to the generator is typically a vector or a matrix of random numbers (referred to as a latent tensor) which is used as a seed for generating an image. The generator will convert a latent tensor of shape (128, 1, 1) into an image tensor of shape 3 x 28 x 28. To achieve this, we'll use a transposed convolution (also referred to as a deconvolution). 

    In our next blog, I will show you the practical concept of GANs - Anime faces generation with the help of PyTorch. 


    Reference - 

    Data Science for Marketing and Planning

    Data science can be applied in marketing and planning to help organizations make better decisions by analyzing large amounts of data from va...